The role of microglia and astrocytes in Alzheimer’s disease and how these contribute to neuronal loss has gained increased interest over the past years. This pathologically feature is recapitulated in reMYND’s transgenic APP, APPxPS1 and hTauP301S mouse models. Progressive astrocytosis and microgliosis have now been found in reMYND’s transgenic hTauP301L model as well (Figure 1).
The hTauP301L transgenic mouse model displays a robust motoric phenotype correlating with an age dependent increase in hyperphosphorylated Tau and the formation of neurofibrillary tangles. Anti-CD68 and anti-GFAP immunohistological staining show a significant 3 to 4-fold increase in the CD68 and GFAP reactive area in aged hTauP301L mice (Figure 1), which is indicative for microgliosis and astrocytosis (Walker and Lue, 2015, Ben Haim et al., 2015).
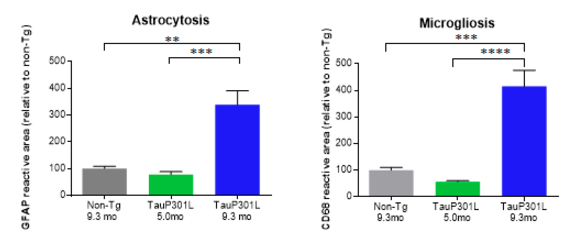
Figure 1: Anti-GFAP (left) and anti-CD68 (right) immunohistological staining in the interposed cerebellar nucleus, anterior and posterior part (deep cerebellar nuclei). Old hTauP301L mice (9.3 months of age (9.3 mo) – advanced neurofibrillary tangle pathology) are compared with non-Tg control mice (9.3 mo) and young hTauP301L (5 mo – absence of neurofibrillary tangles). Quantifications are shown as % reactive area of the region of interest relative to the % reactive area for the non-Tg control mice.. * p < 0.05, ** p < 0.01, *** p < 0.001, **** p < 0.0001.
Aged hTauP301L mice (9.3 months of age) displaying neurofibrillary tangle pathology were compared with non-Tg controls (9.3 months of age) and young hTau.P301L mice (5.0 months of age) without any neurofibrillary tangle pathology (Figure 2). The increase in activation of microglia and astrocytes correlates with the level of neurofibrillary tangle pathology observed (Figure 3).
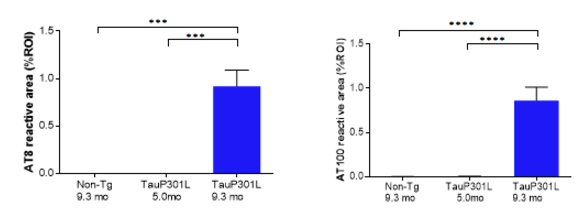
Figure 2: AT8 (pSer202 and pThr205, left) and AT100 (pThr212 and pSer214, right) immunohistological staining in the interposed cerebellar nucleus, anterior and posterior part (deep cerebellar nuclei). Quantifications are shown as % reactive area of the region of interest. * p < 0.05, ** p < 0.01, *** p < 0.001, **** p < 0.0001.
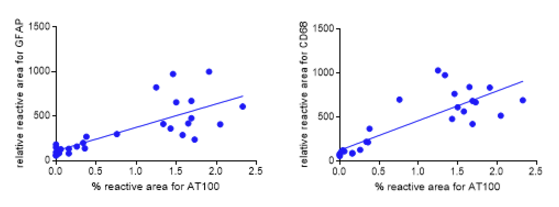
Figure 3: Correlation of astrocytosis and microgliosis with neurofibrillary tangle pathology. The % reactive area for AT100 (pThr212 and pSer214) is plotted against the relative reactive area for GFAP (left) and CD68 (right). R square is 0.5798 and 0.6986 for GFAP and CD68, respectively.
reMYND, Bio-Incubator (Wetenschapspark)
Gaston Geenslaan 1
BE-3001 Leuven (Heverlee)
Belgium
RPR Leuven, 0476.910.101
BTW/VAT: BE0476.910.101
T +32 16 75 14 20
F +32 16 75 14 21
info@remynd.com